GIS Skills
A summary of the GIS skills I have learned professionally and academically.
Desktop GIS
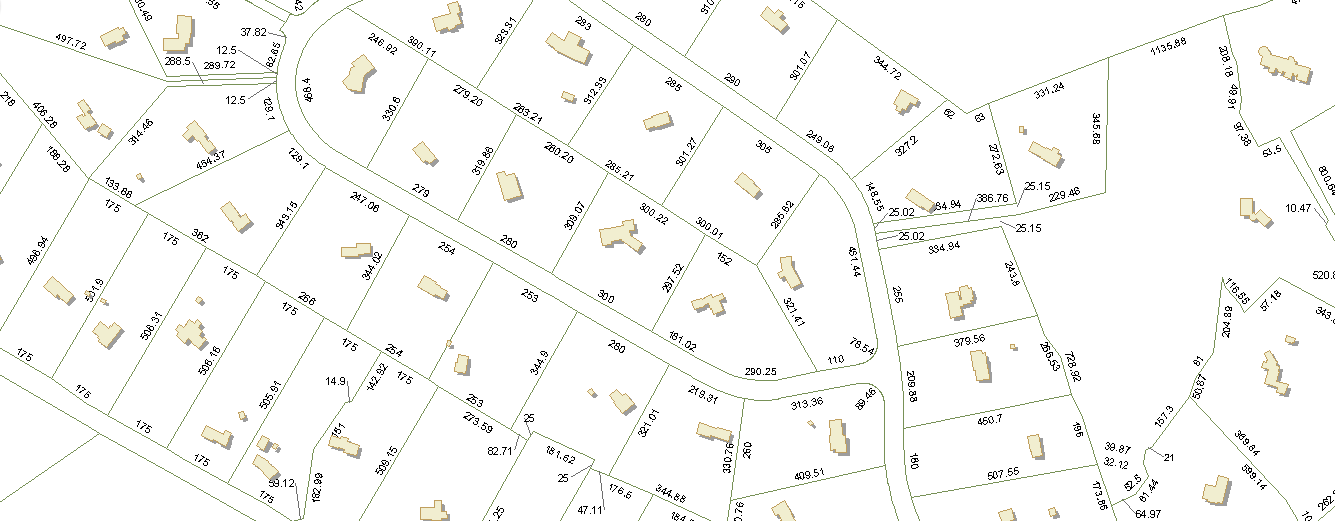
During my career I have primarily used Esri products, from ArcInfo Workstation to ArcView 3.x to the current release of ArcGIS Desktop. Through my use of ArcGIS Desktop and design classes while at Penn State, I have built a strong background in cartographic design. Having started in the command line environment of ArcInfo Workstation, which gives me an appreciation of how far desktop GIS has evolved over the years. My first job out of college, at ECS, primarily focused on property mapping using ArcInfo Workstation, this gave me a strong foundation for GIS data entry. From property mapping, my next career focus was GIS data collection for utility infrastructures at WK Dickson.
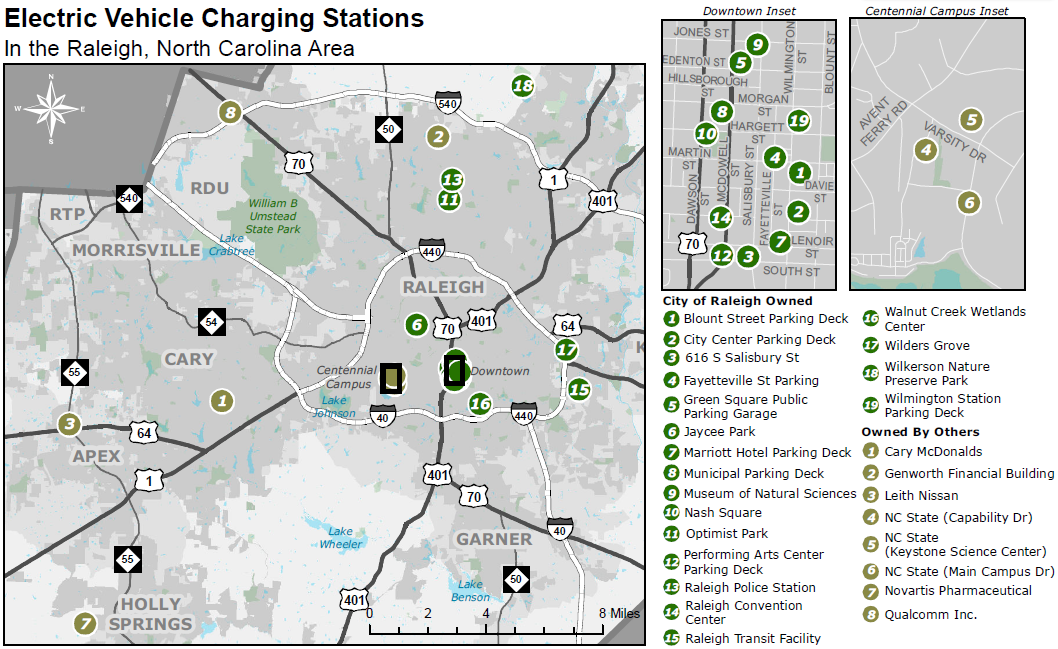
While at NC State University, I was able to apply my cartographic design skills to the cartography based course. For a final project for that course, I mapped the locations of all of the electric vehicle charging stations (at the time) located in the City of Raleigh.
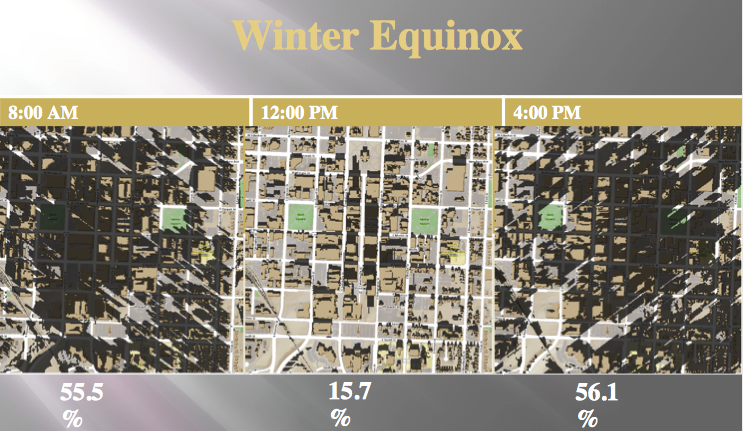
In addition to Esri products, I have some experience with open source desktop GIS products, including QGIS and GRASS. The later was a software package that was the primary focus for the Geospatial Modeling and Analysis course at NC State University. The image below is from the final project for this course which analyzed the affect of building shadows in downtown Raleigh.
Server GIS
My first experience with server GIS began with using ArcIMS while at WK Dickson. This then changed over to ArcGIS Server a few years later. At WK Dickson we hosted project related data for client and internal use. This was a simple way to show the client their project data while it was being collected in the field. My use of ArcGIS Server increased exponentially when I started at the City of Raleigh. My first task was to install ArcGIS Server and then create 30 to 40 map services using countywide data for consumption in the iMAPS property research application. Since then, I administer two ArcGIS Server implementations, one internal and one external, as well as setup ArcGIS Server for the Cityworks team.
Database Management
At the beginning of my GIS career, I managed ArcGIS coverages in ArcInfo Workstation to store parcel datasets. With the release of Esri's personal geodatabase format, I began administering geodatabases at WK Dickson, primarily for storing utility infrastructure data. I had not worked at a firm that had ArcSDE capabilities until I started with the City of Raleigh. At the City, I have assisted our GIS Database Adminstrator with storing and maintaining GIS data inside of the City's Oracle database. This is the City's primary GIS storage mechanism.
While at the City of Raleigh and at NC State, I was exposed to using open source databases as well. These databases include PostgreSQL, with the PostGIS extension and MongoDB, which is a NoSQL database. I recently developed new application created for the Capital Area Transit which stored adopted bus shelter information in a PostGIS database. MongoDB was used to store development data for the Development Dashboard application, which was used for my Masters project at NC State.
Programming
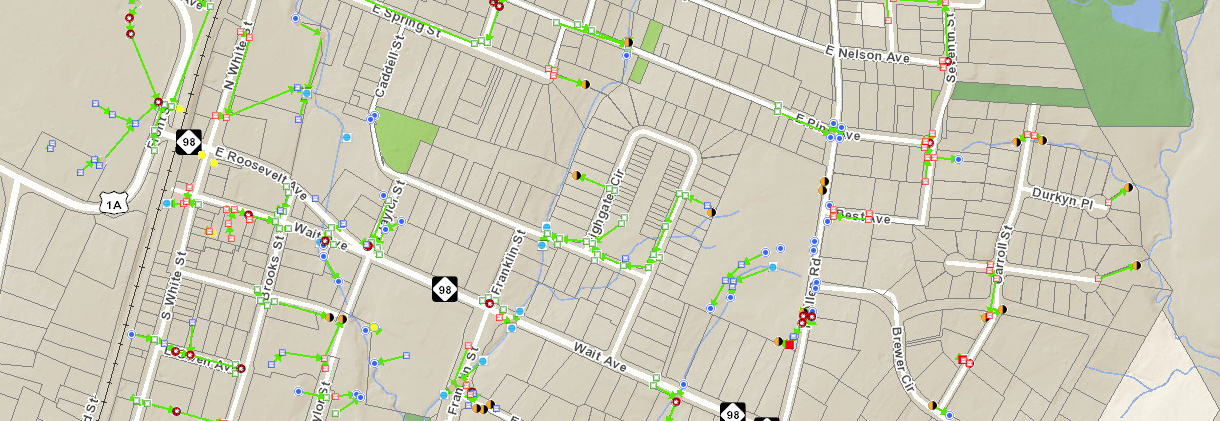
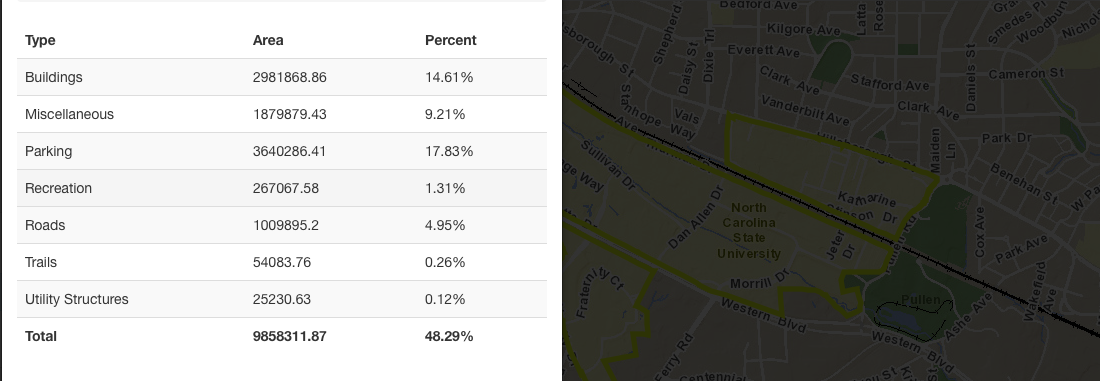
Throughout my GIS career, writing scripts to manage GIS related data has been an important task. While working at WK Dickson, I was responsible for the coding of their Connectivity tool, which took GPS'd manholes and stormwater features and automatically drew the pipes between the features based on their IDs. This process helped alleviate the process of manually connecting pipes to features by an analyst. Another process that I assisted in updating the code for was C# ArcObjects code which calculates the amount of impervious surface located on each property in the City. This code basically intersects each property with the City's impervious surface layer and then measures the amount by category and stores those measurements in the City's stormwater database.
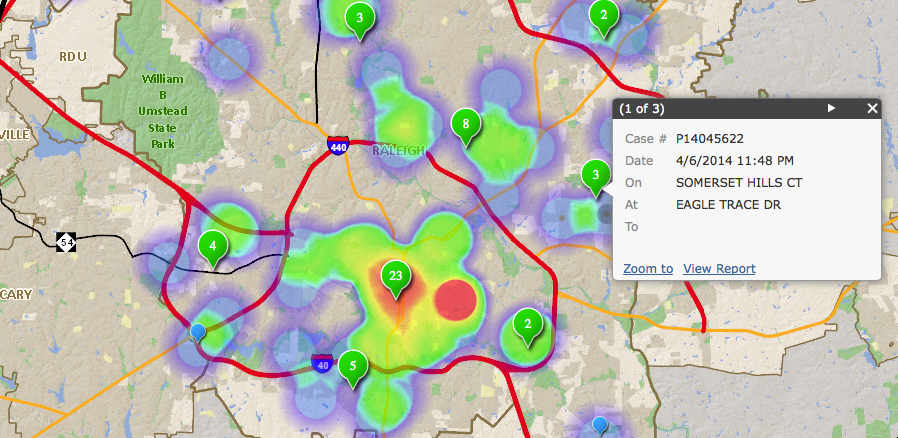
Most of my Python script began when I started with the City of Raleigh. The primary tasks I run with Python scripts involve taking data from tabular format and then mapping them as point locations in our GIS database. One such example is an application I built for the Raleigh Police Department that takes data from their SQL Server crash database and then stores them in an SDE database as points using the coordinate typed in my the officers at the scene.
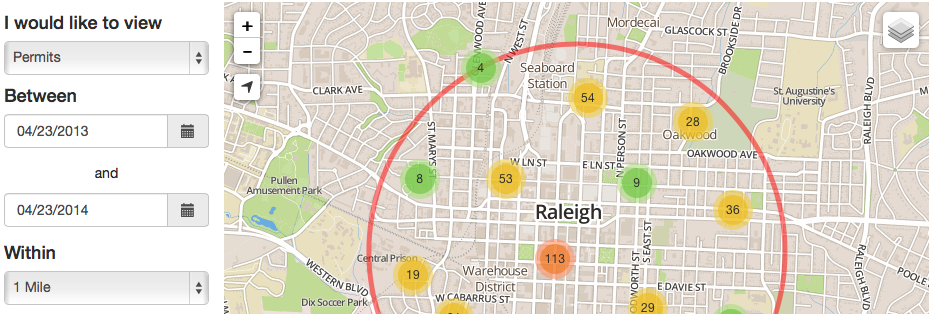
Python was also used in my final Masters project at NC State. These Python scripts consumed a web service of updated permits and development plans and stored them in a MongoDB database on a different server.
Also Python was the basis of the development course that is part of the GIST program at NC State. As the final project for this course, I replicated the stormwater measurement process mentioned above, but applied to to reporting the amount of impervious surface for a single property by a mouse click.
Web Mapping Application Development
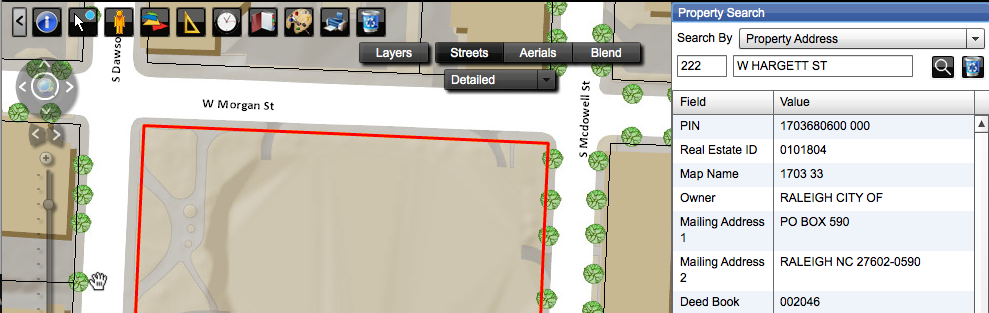
My web application development started with managing ArcIMS web applications while at WK Dickson. The purpose of these web application was to allow for our clients to be able to view project data while it was being collected in the field. After I began using ArcGIS Server, I built web applications using Esri's Web ADF framework. However my passion for application development began when I started using Esri's Flex API. This lead to getting hired as a developer for the City of Raleigh, who was planning to migrate their iMAPS property research application from ArcIMS to ArcGIS Server. With the popularity of the Flex API at the time, they decided to move in that direction. My first project while at the City was to handle this migration process by rewritting iMAPS from scratch.
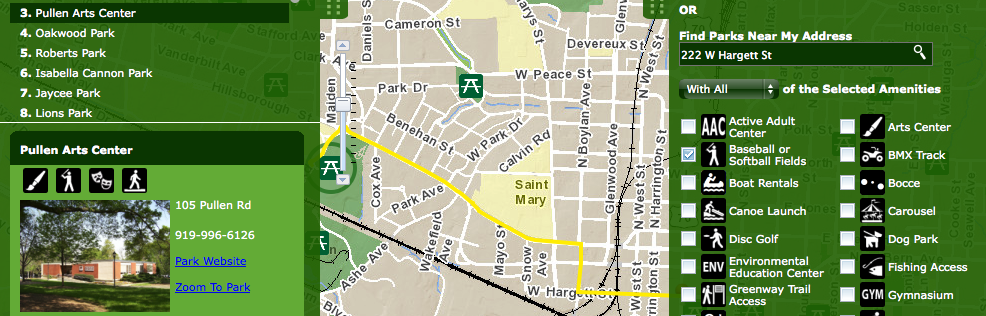
With the increase of mobile technology with both smart phones and tablets, the use of Flex began to decline. This lead to me to move my focus away from Flex and toward JavaScript. This started with the ArcGIS JavaScript API, which I have used to develop several applications including the City's Park Locator. However with my interests shifting to open source software, the majority of my web mapping applications now use the Leaflet JavaScript library. In addition to Leaflet, much of that data that I use for my applications are in open source formats such as GeoJSON and TopoJSON.
In addition to web development, I also have experience with native app development for mobile operating systems. The City's iMAPS Mobile application is available in the Apple App Store and was developed using XCode, Objective-C, the iOS SDK, and the ArcGIS Runtime SDK for iOS. I also have plans to replicate the application using Android as well.
While at NC State, I also gained some experience with web application development. The Masters Project at NC State required the development of a web mapping application as the end product. The theme for my project was to develop a 100% open source application. The project that was selected was a Development Dashboard for the City of Raleigh's Planning and Development Department. The app supplies citizen's an easy to use interface for discovering what development is occurring in their area of the City. The app was developed on a Python server hosted by Redhat using the Openshift service. All the data was stored in a MongoDB database and then exposed to the web through a Flask web service. The front-end of the application utilized Leaflet for the map and Bootstrap for the overall framework of the application, as well as D3 for charting.